## 환율을 조사해보자
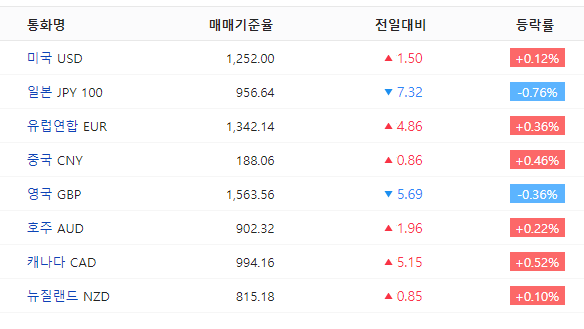
환율조회 : 네이버 통합검색
'환율조회'의 네이버 통합검색 결과입니다.
search.naver.com
> 요기서 url을 받아온다
import pandas as pd

# url 지정
url = 'https://search.naver.com/search.naver?where=nexearch&sm=top_hty&fbm=0&ie=utf8&query=%ED%99%98%EC%9C%A8%EC%A1%B0%ED%9A%8C'

pd.read_html(url)
위 url 내용을 주피터 노트북에 불러올 수 있다.
tables = pd.read_html(url)
tables[0]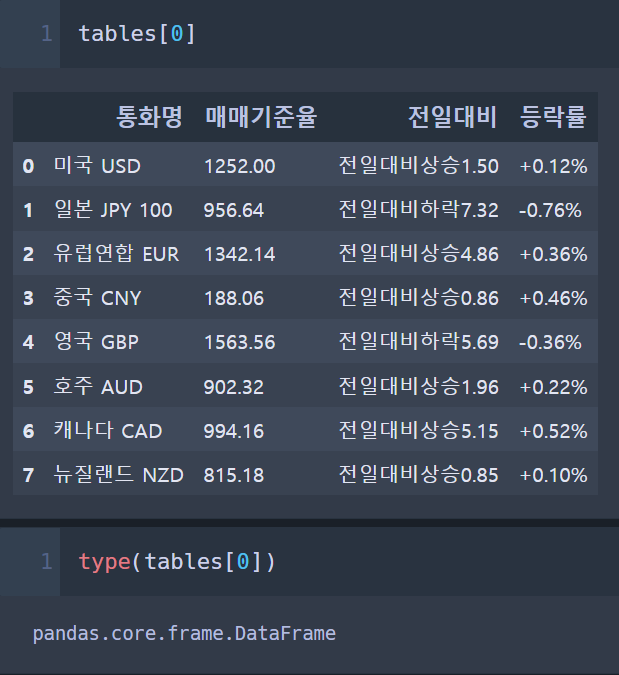
>> DataFrame 형으로 출력
# 한글 폰트 이름 확인

import matplotlib.pyplot as plt
import matplotlib
import matplotlib.font_manager as fm

font_name = fm.FontProperties(fname = 'C:\\Windows\\Fonts\\malgun.ttf').get_name()
matplotlib.rc('font', family='font_name')
plt.rc('font', family='Malgun Gothic')
>> 한글 폰트 깨짐 방지
df = tables[0]
df.set_index(df['통화명'], inplace=True)

del df['통화명']
df
>> 데이터프레임을 이름을 df로 지정해주고
index를 '통화명' 지정해주고 업데이트한 뒤
>> 중복된 '통화명'열 삭제
df.plot(figsize=(8,6), title='네이버 환율 정보', grid=True)
* 매매기준율 : 매수 및 매도의 기준이 되는 환율
from datetime import datetime

cur_time = datetime.now()
df.to_excel('네이버 환율 정보_'+cur_time.strftime('%Y-%m-%d')+'.xlsx', index=False)
>> excel로 저장
tables = pd.read_html(url)
df = tables[0]
df.set_index(df['통화명'], inplace=True)
df.rename(columns={'통화명':'외환'}, inplace = True)
df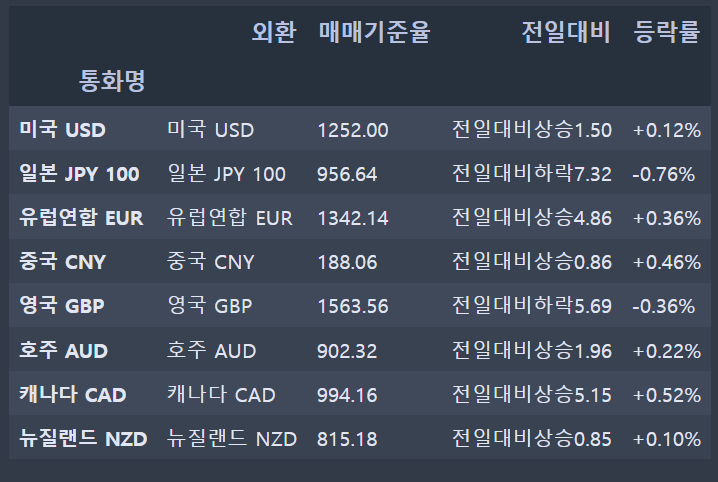
>> url을 판다스로 불러들어 index를 '통화명', column에 있던 '통화명'을 '외환'으로 바꿔줌
df.plot(kind='bar', stacked=True, figsize=(8,6))
plt.title('네이버 환율 정보')
plt.show()
>> stacked bar 형태
df.plot(kind='barh', stacked=True, figsize=(7,4))
plt.title('네이버 환율 정보')
plt.grid()
plt.show()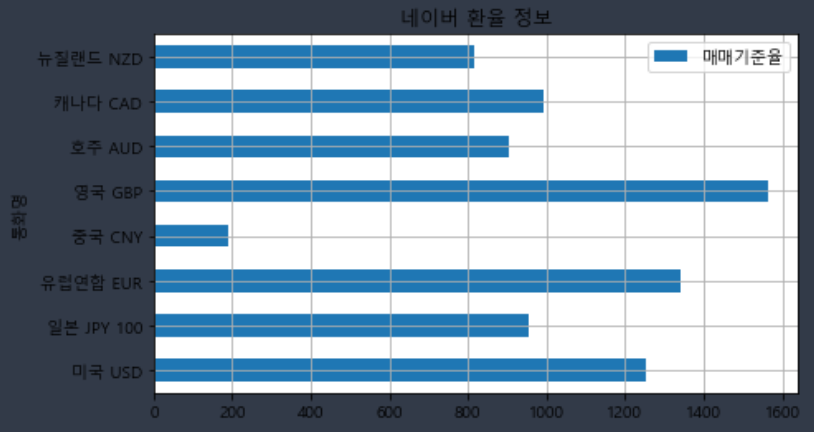
>> 수평 막대 그래프
df.plot(kind='area', alpha=0.5, grid=True, figsize=(7,4))
plt.title('네이버 환율 정보')
plt.xlabel('국가명')
plt.ylabel('매매기준율')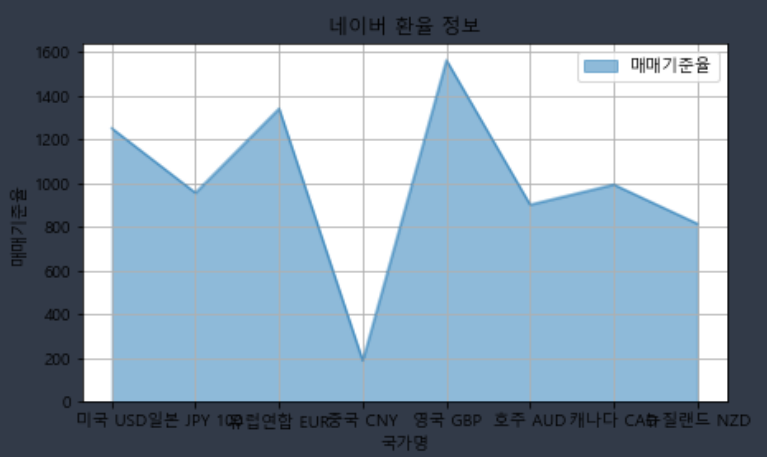
>> 면적 그래프